Single-Gene Query
You can explore the significantly called m6A sites and m6A methylation levels on the gene you are interested in.

m6A Sites Information: This table displays signficant m6A sites identified by site calling with FDR < 0.05.
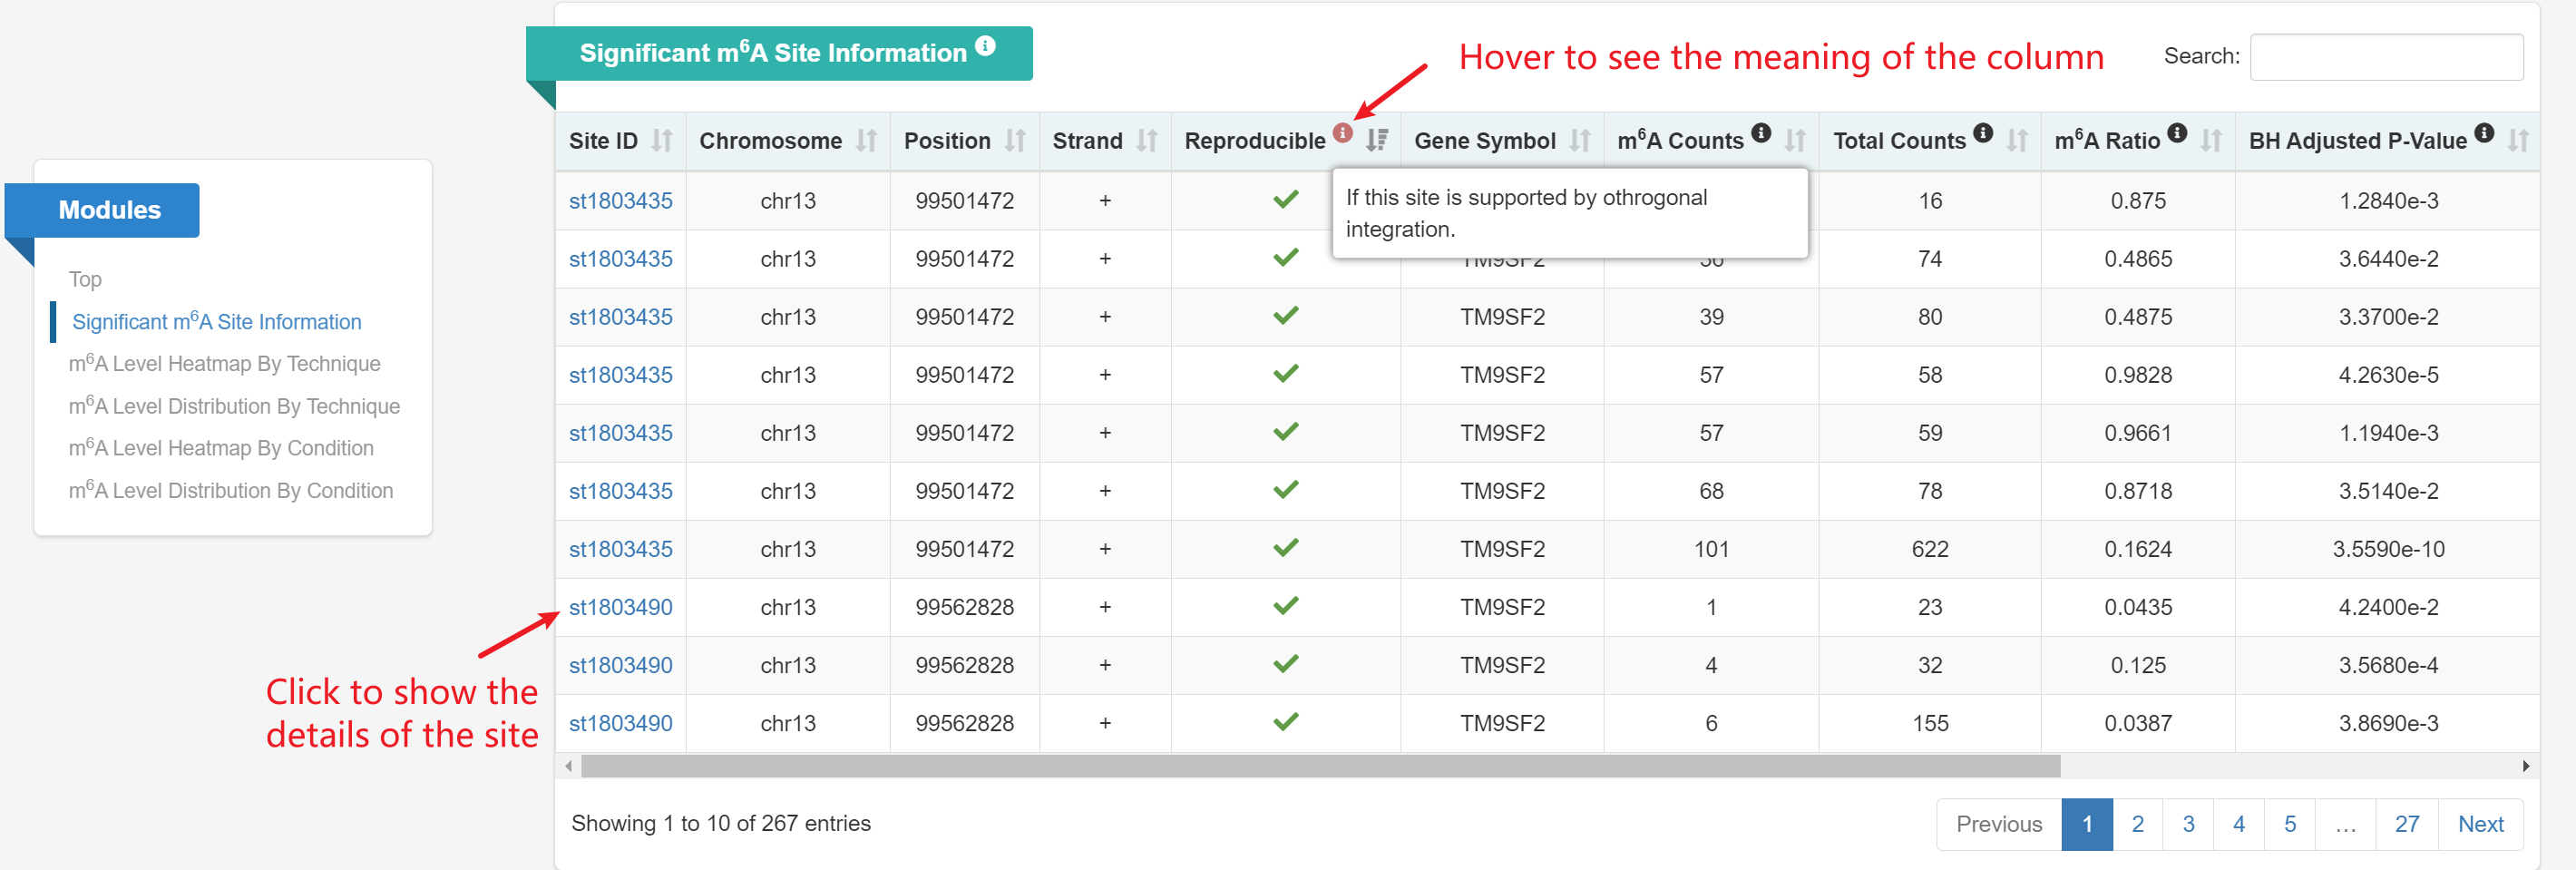
m6A Site Details: This page displays detailed information about a specific m6A site, including the site ID, genomic location, supported samples and techniques, as well as integration and site calling results.

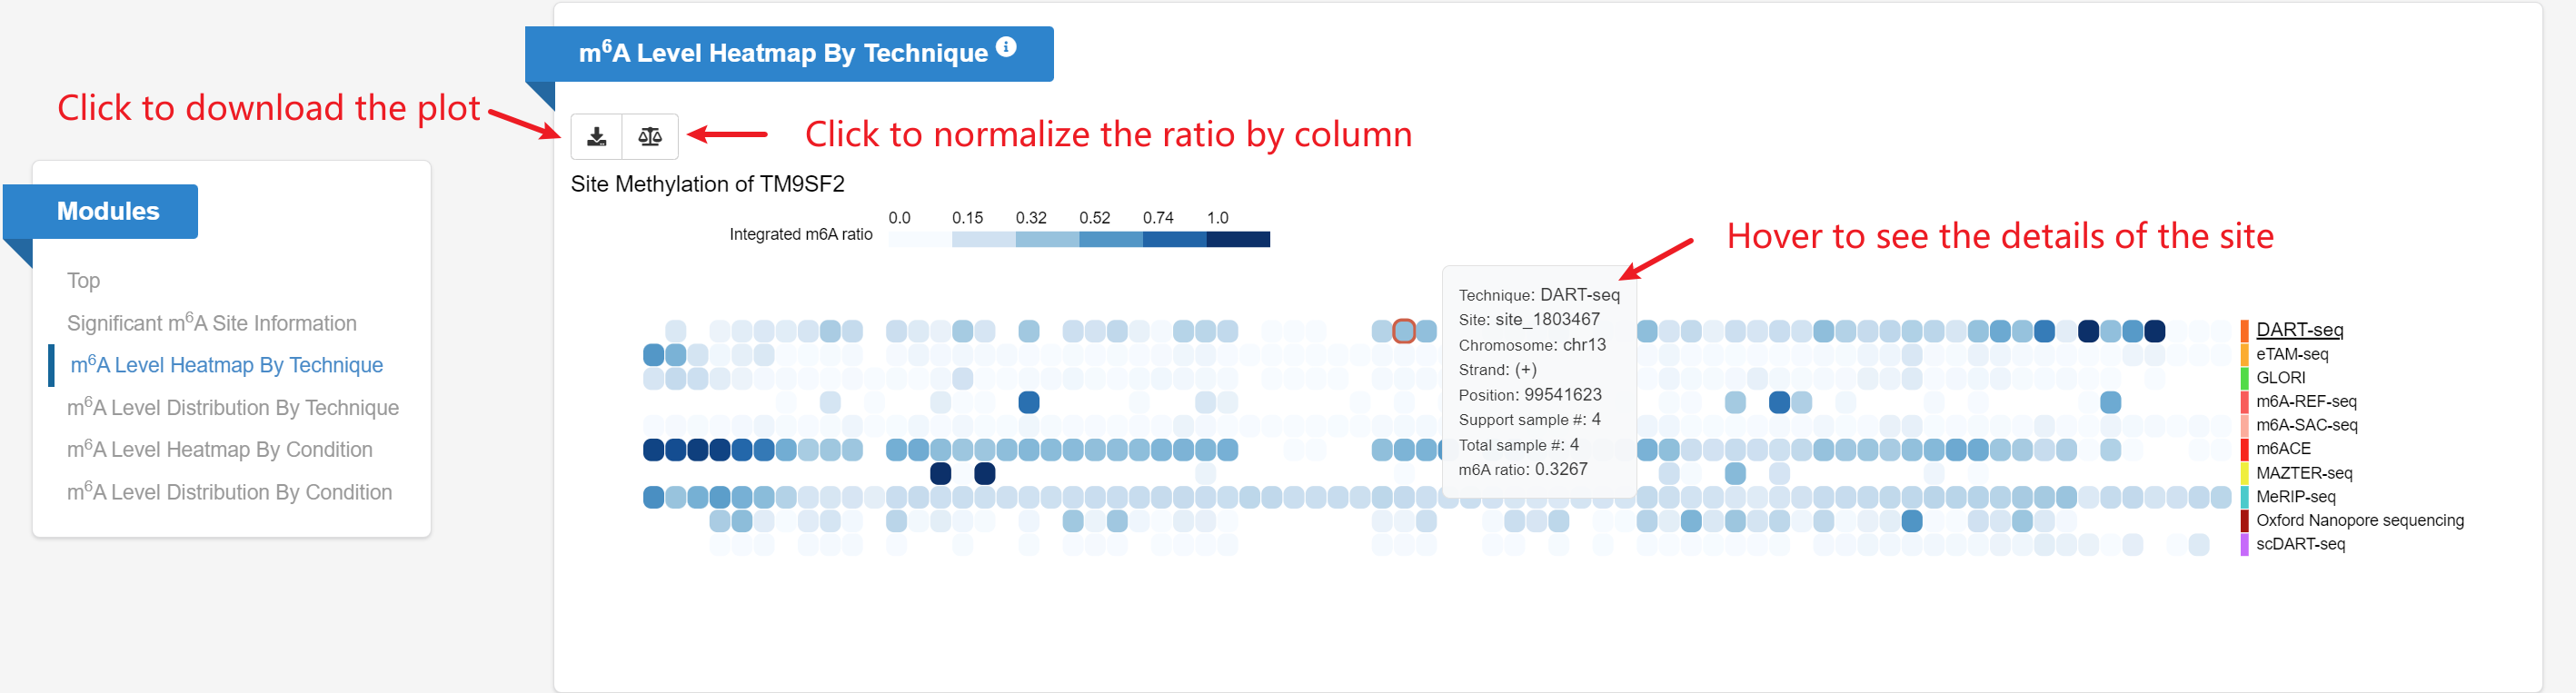
m6A Level Heatmap by Technique: Given a gene query, the heatmap displays m6A levels for each candidate site (row) on the gene
across multiple techniques (columns).
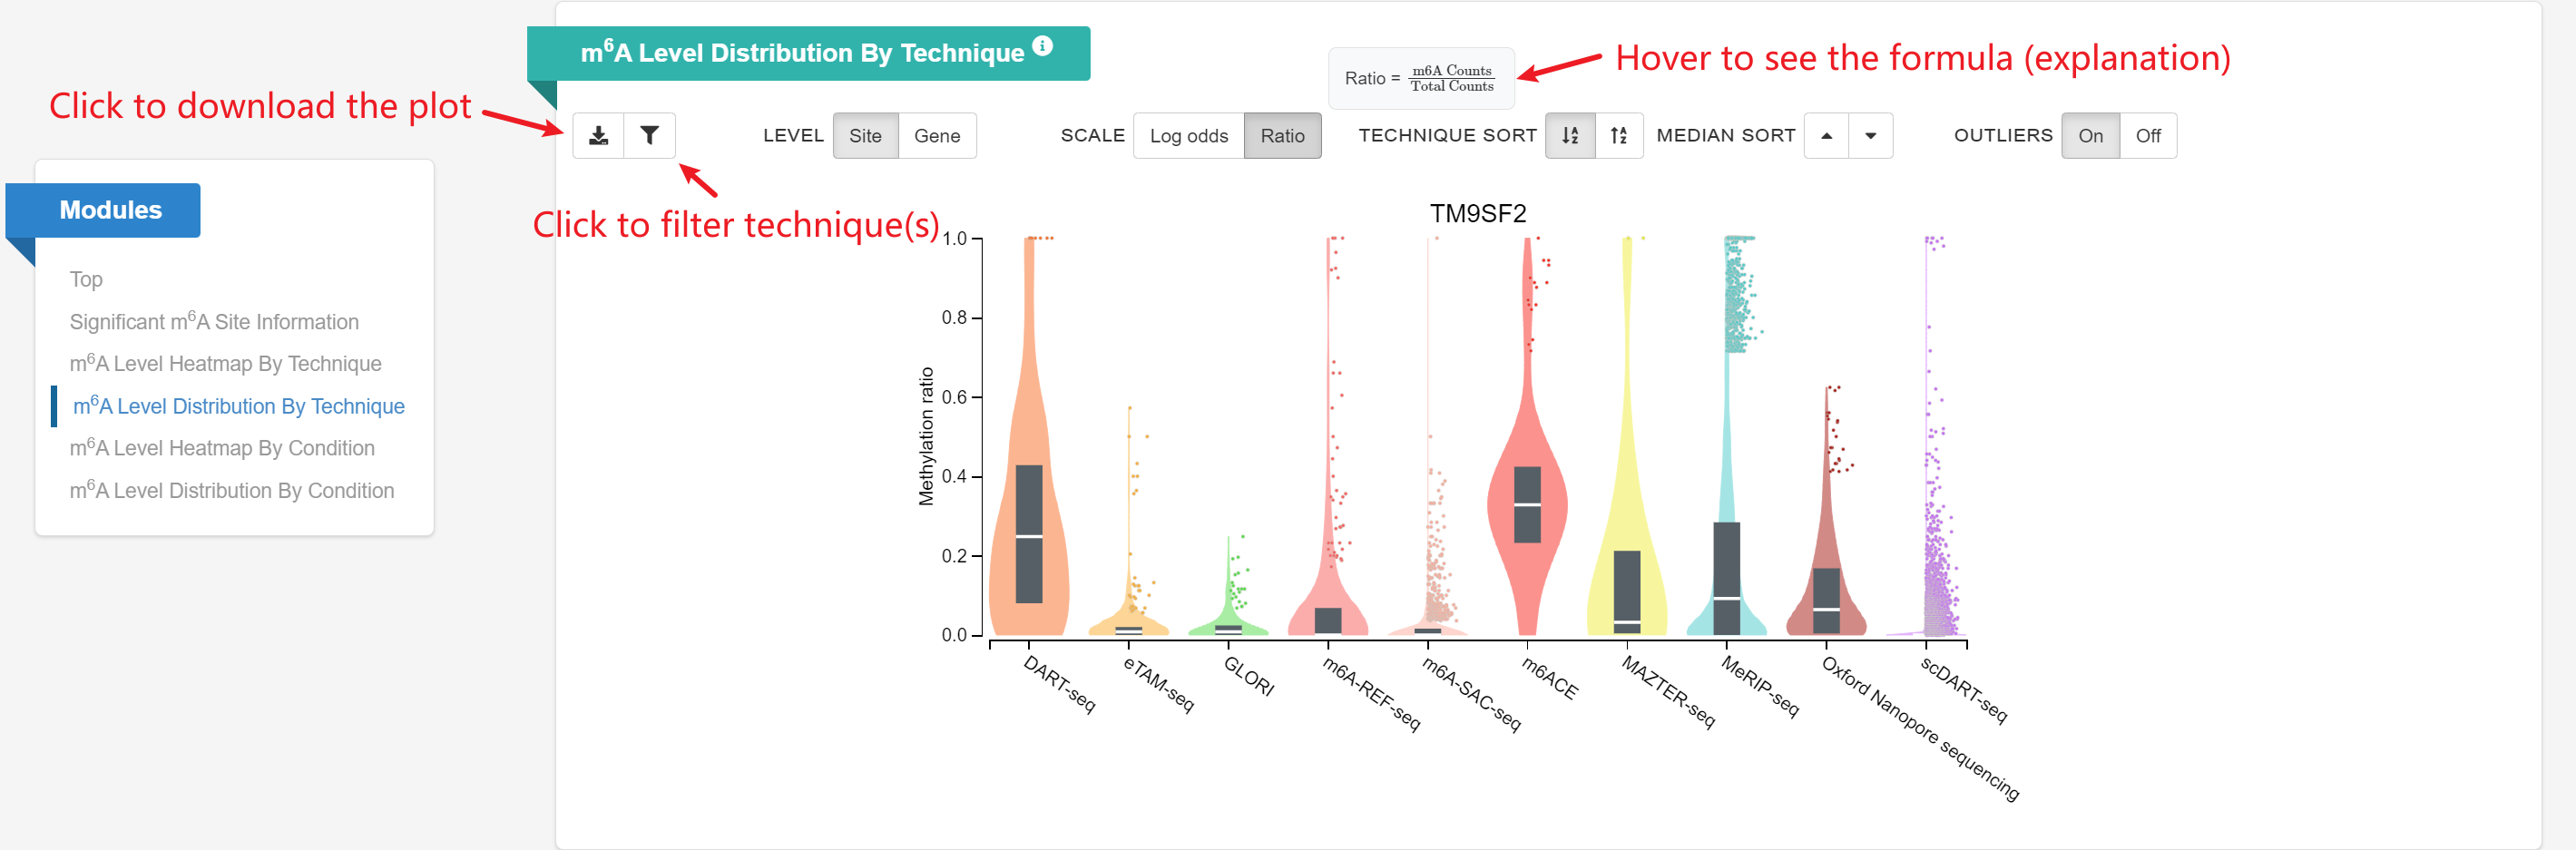
m6A Level Distribution By Technique: Given a gene query, the violin plot displays the distribution of sites’ m6A ratio on this gene across different techniques.
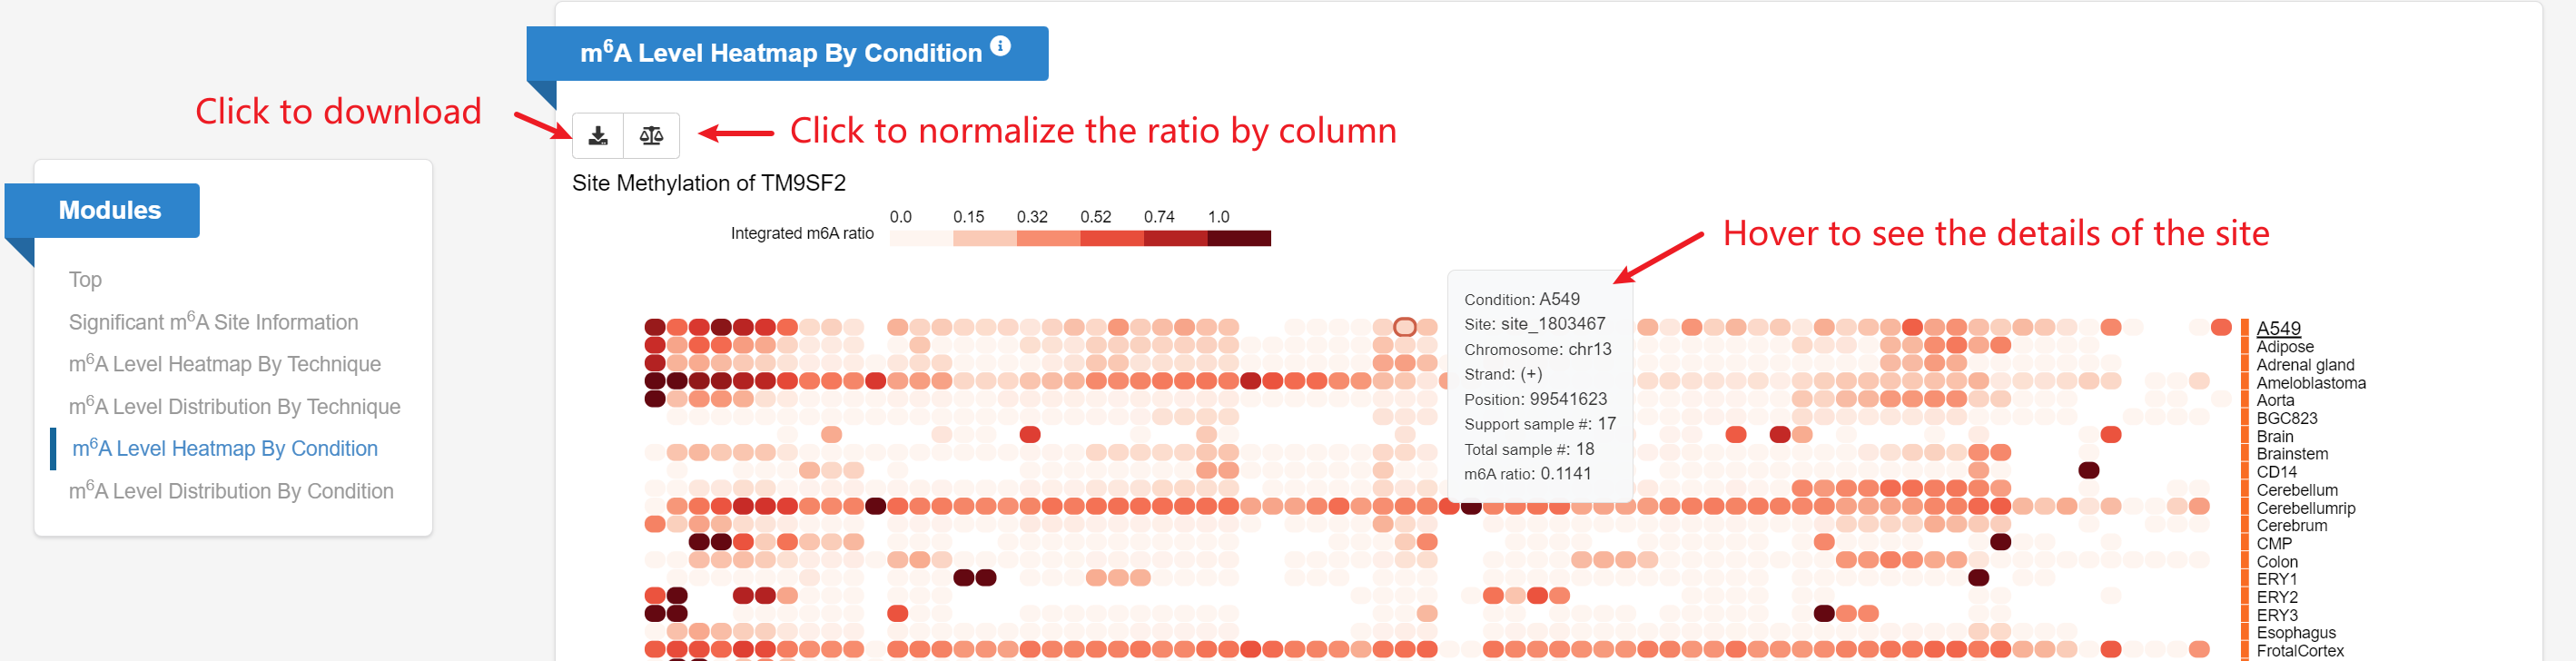
m6A Level Heatmap By Condition: Given a gene query, the heatmap
displays the sites’ m6A ratios (rows) on this gene across different
conditions (columns).
m6A Level Distribution By Condition: Given a gene query, the violin plot
displays the distribution of sites’ m6A ratio on this gene across
different conditions.

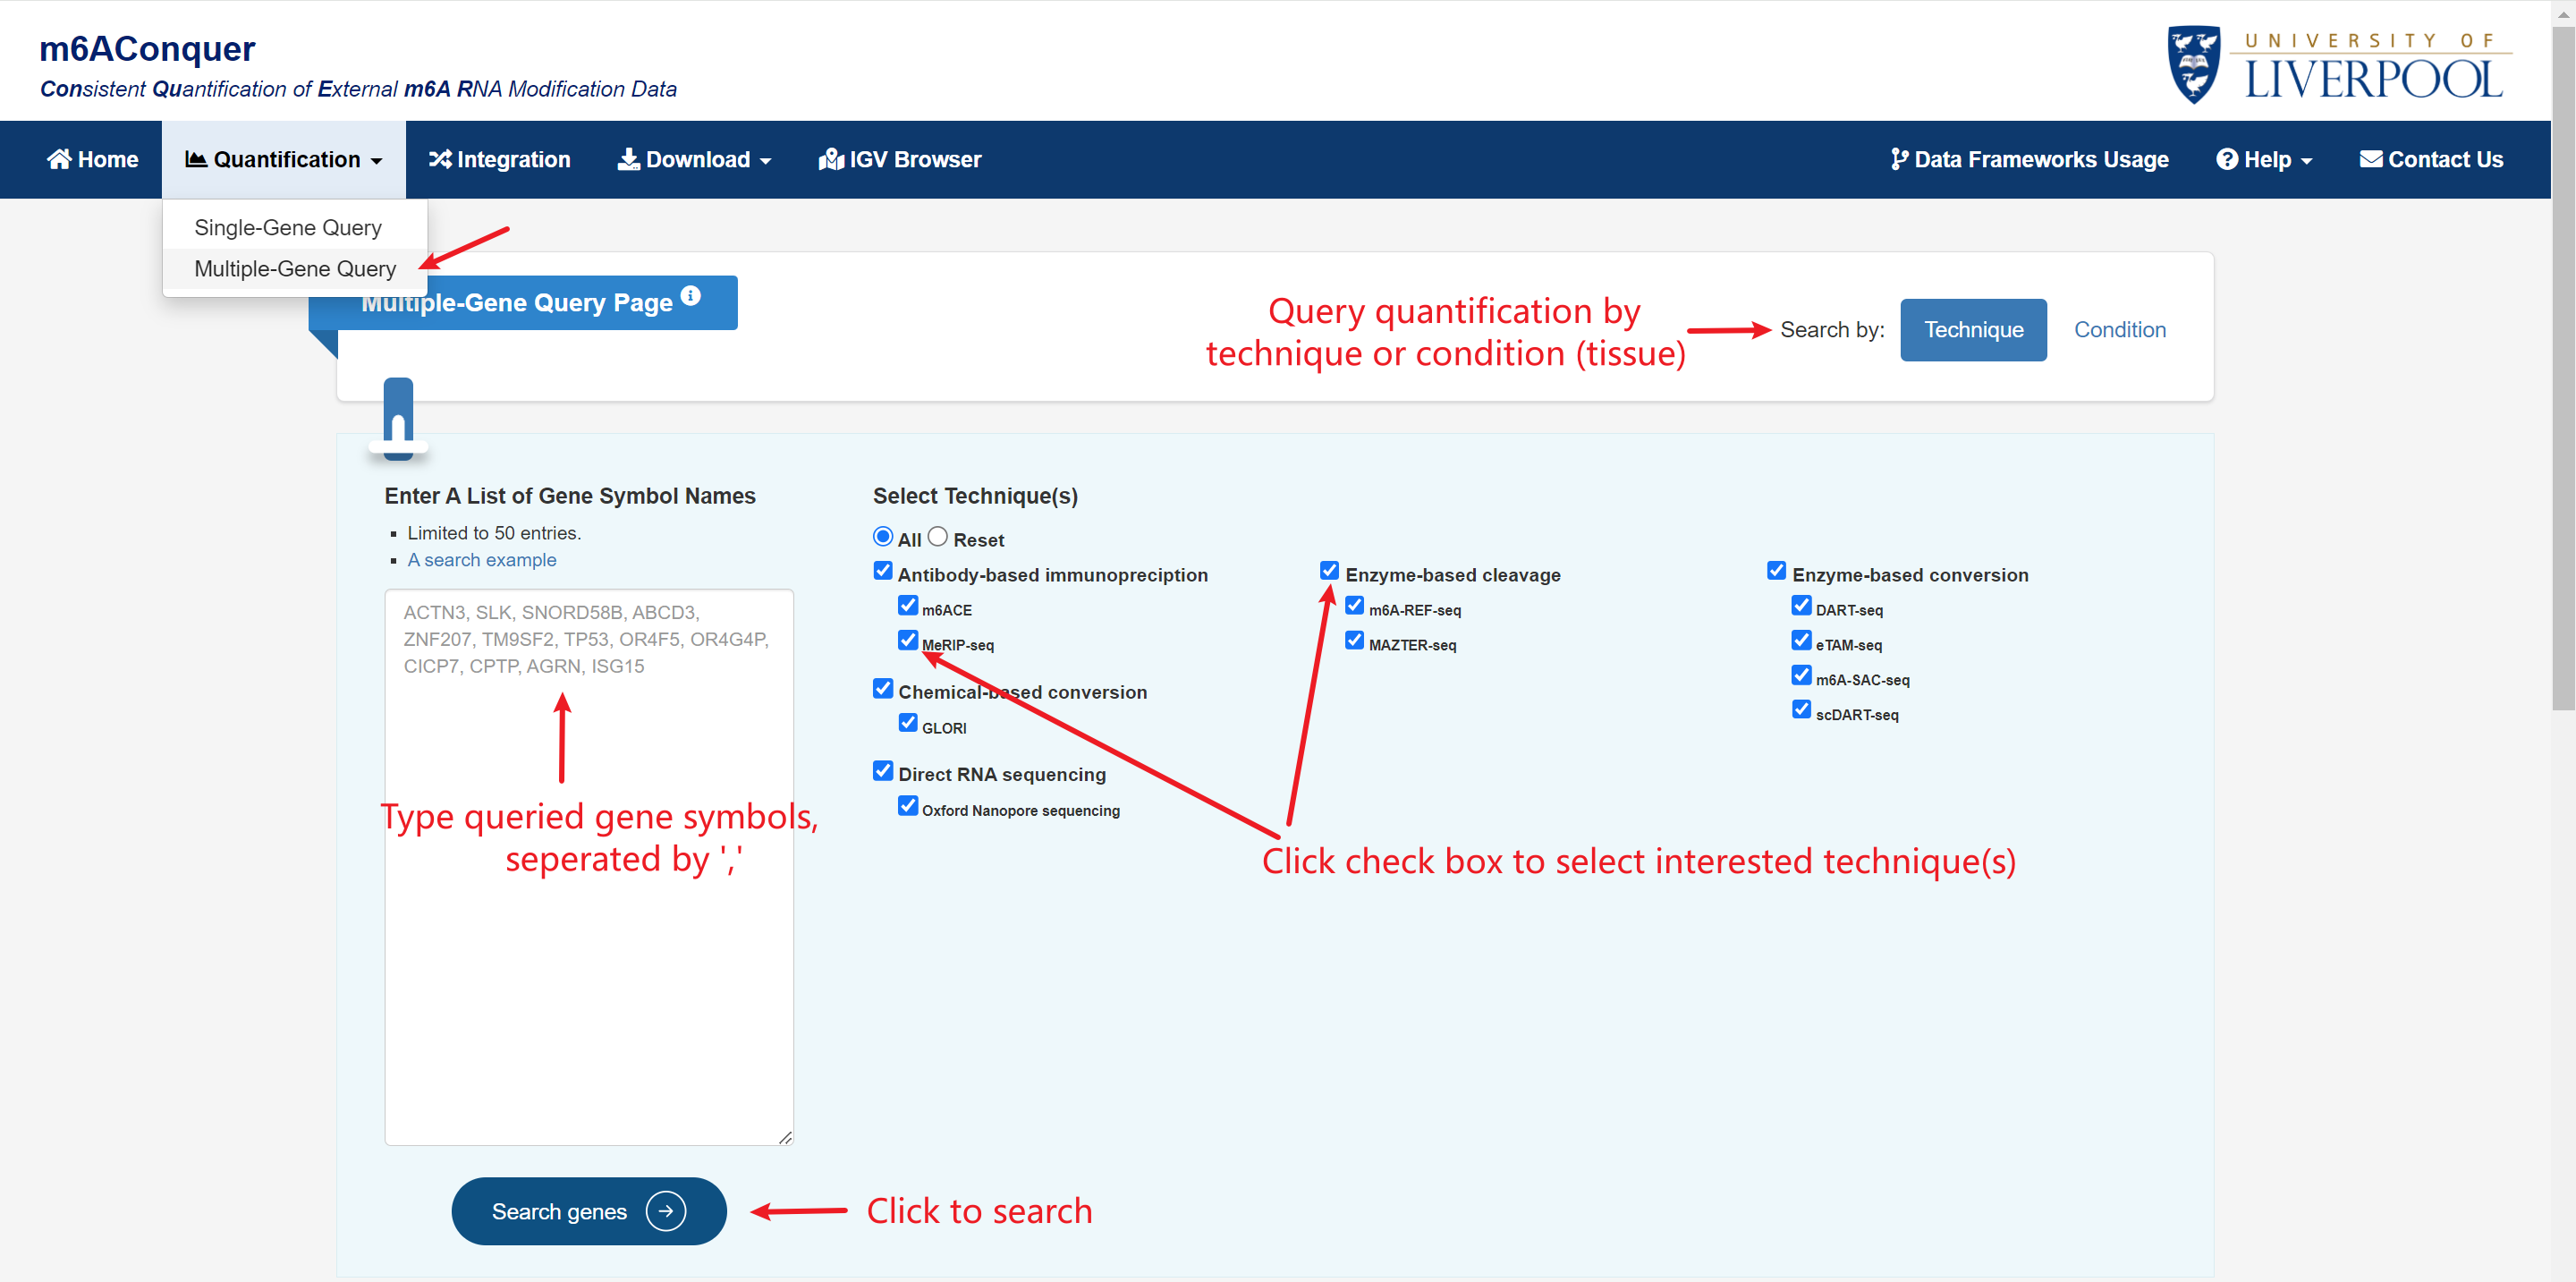
Multiple-Gene Query
You can explore the patterns and variations of m6A methylation ratios on multiple genes you are interested.
The heatmap denotes the combined m6A methylation ratios on the queried genes (rows) from different techniques/conditions (columns).
The violin plot denotes the distribution of combined m6A methylation ratios on the selected genes from different techniques/ conditions. You may select more genes for visualization from the row labels of the heatmap above.

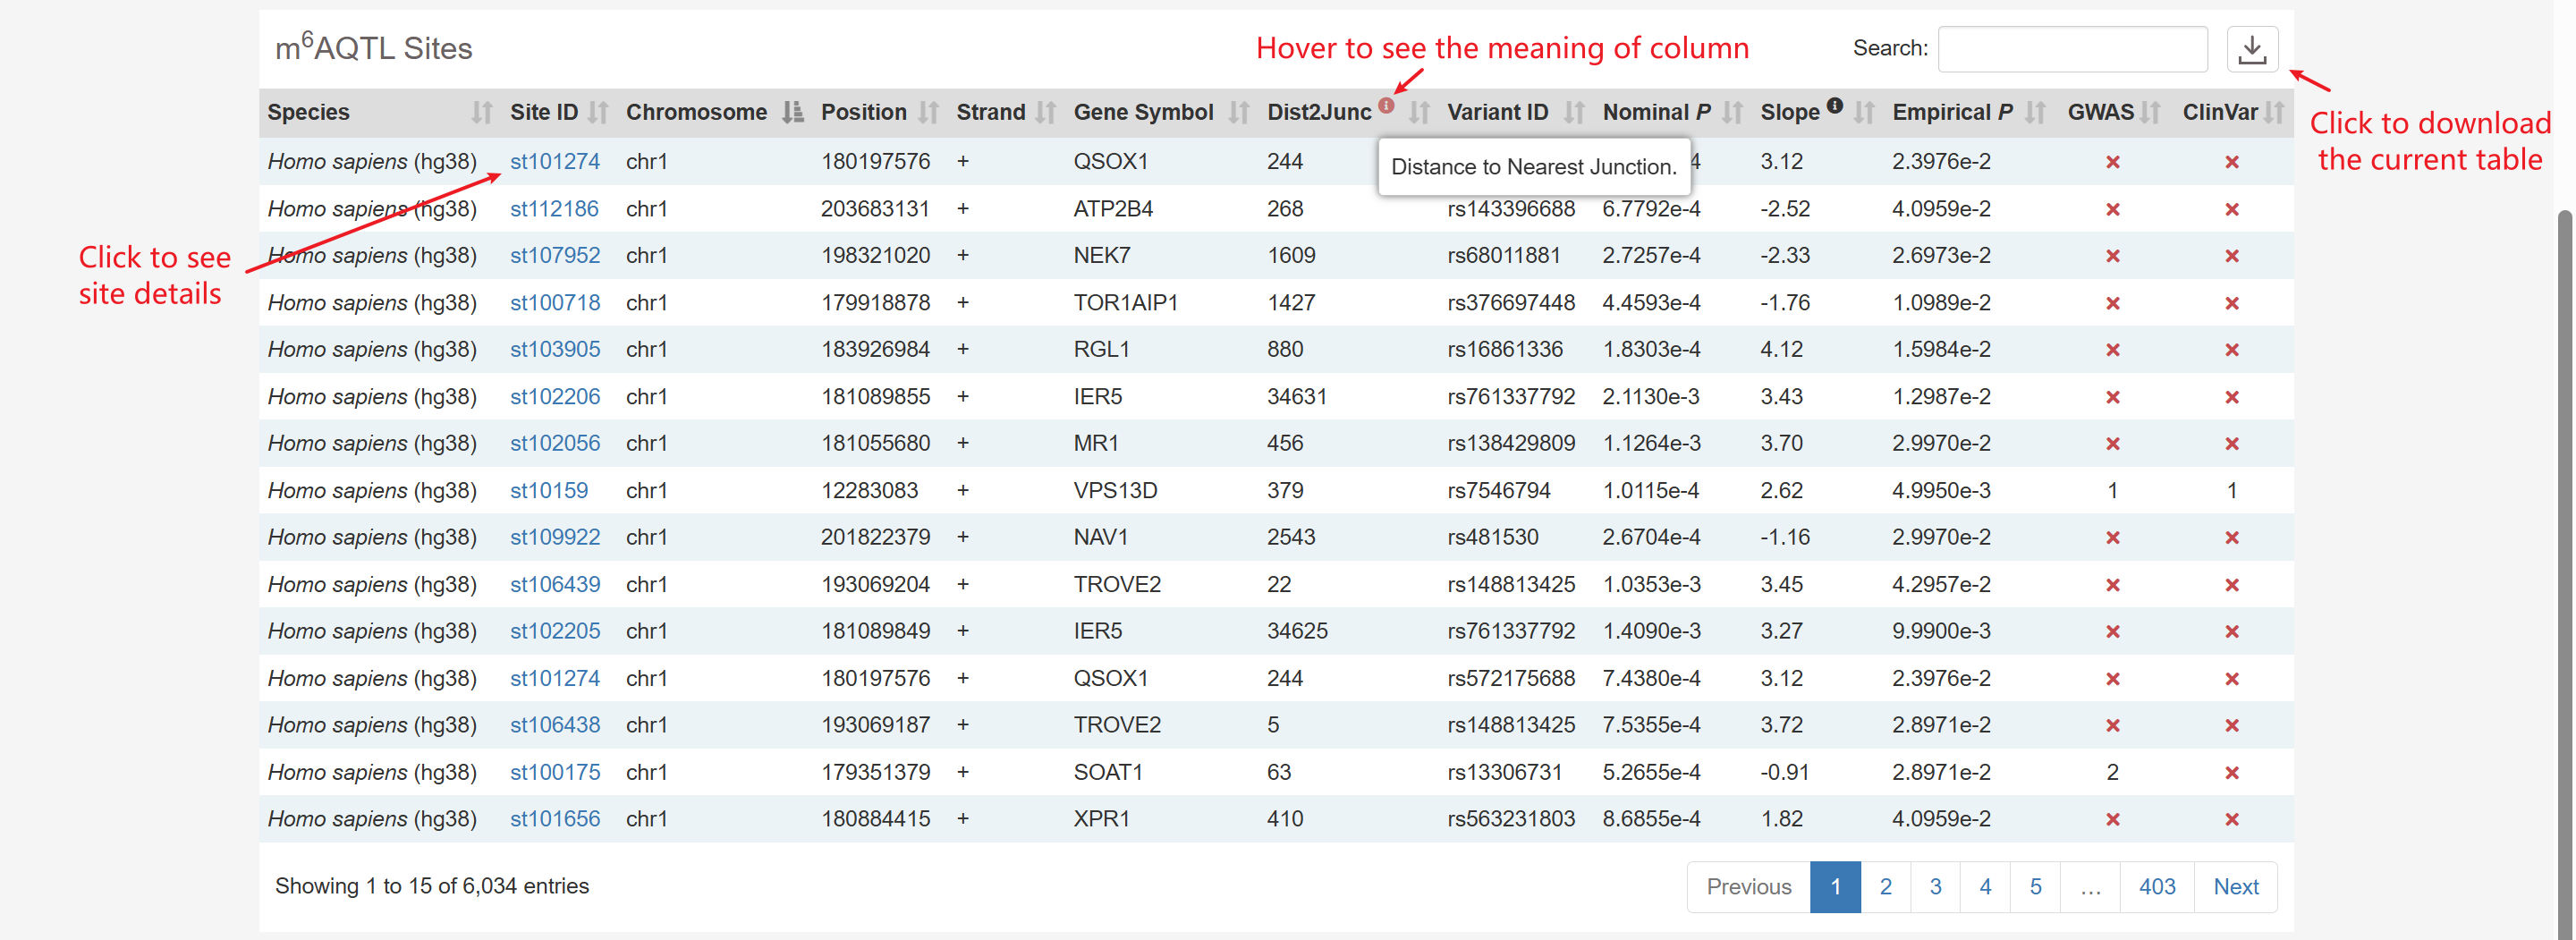
m6A QTL
You can query the m6A QTLs in m6AConquer by filtering nominal P-Value, empirical P-Value, and disease annotation from GWAS or ClinVar.

m6A QTL Sites: m6A QTLs (m6A Quantitative Trait Loci) are genetic variants (e.g., SNPs) associated with variation in N6-methyladenosine (m6A) methylation levels on RNA.
Integration
You can perform integration of two m6A profiling methods by
identifying sites that are reproducible between them. The samples within each techniques are
combined by summation among replicates. The combination can be made within condition if
a common biological condition between techniques is selected.
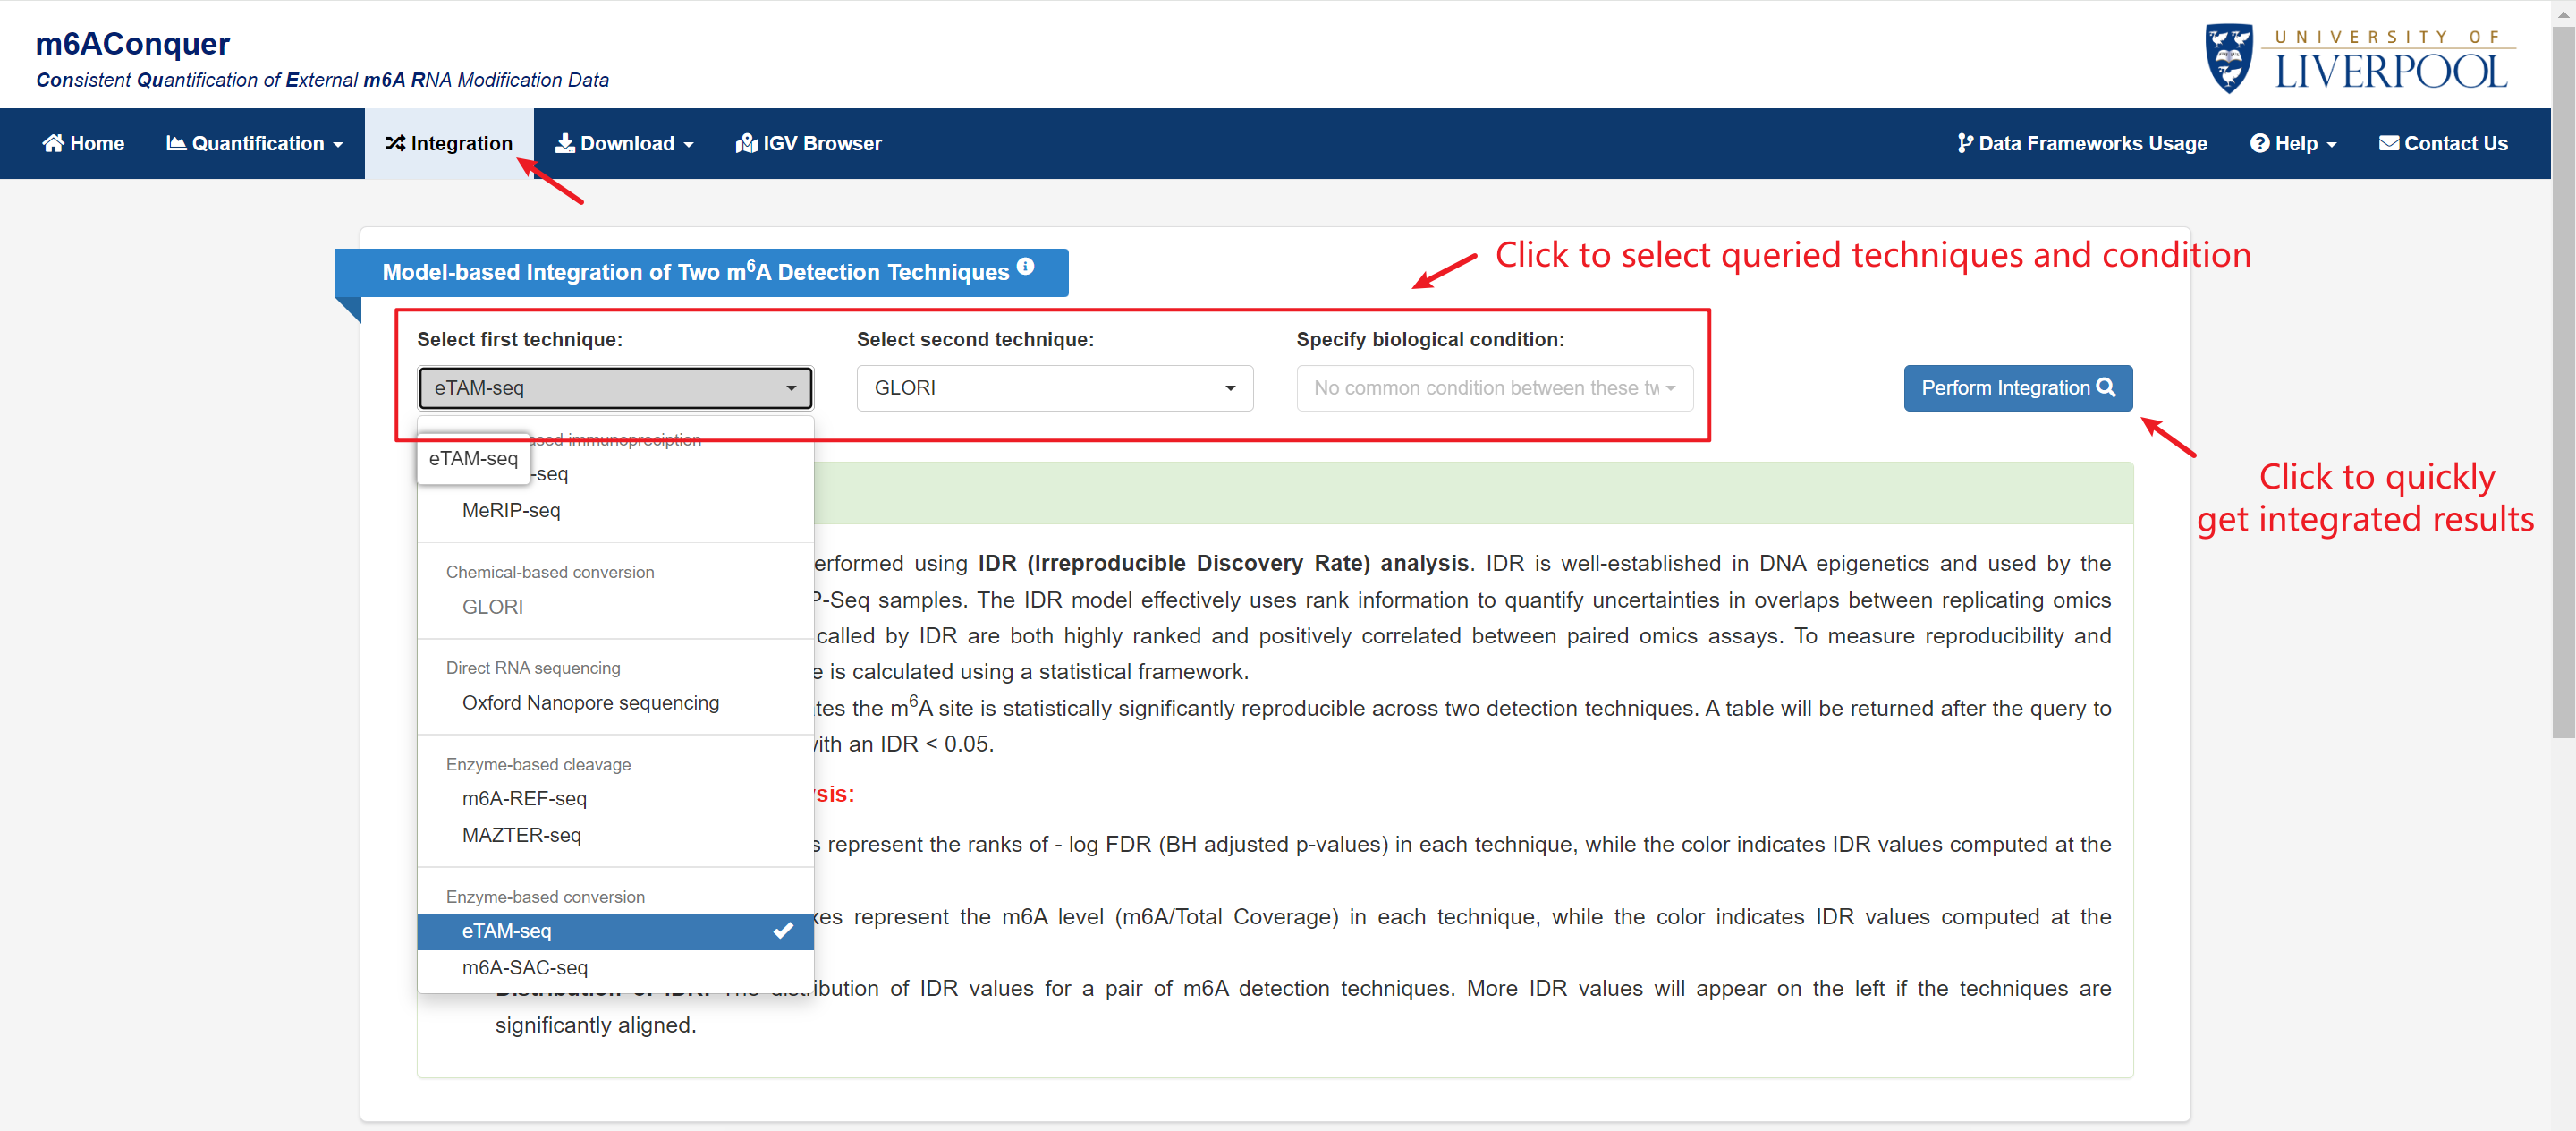
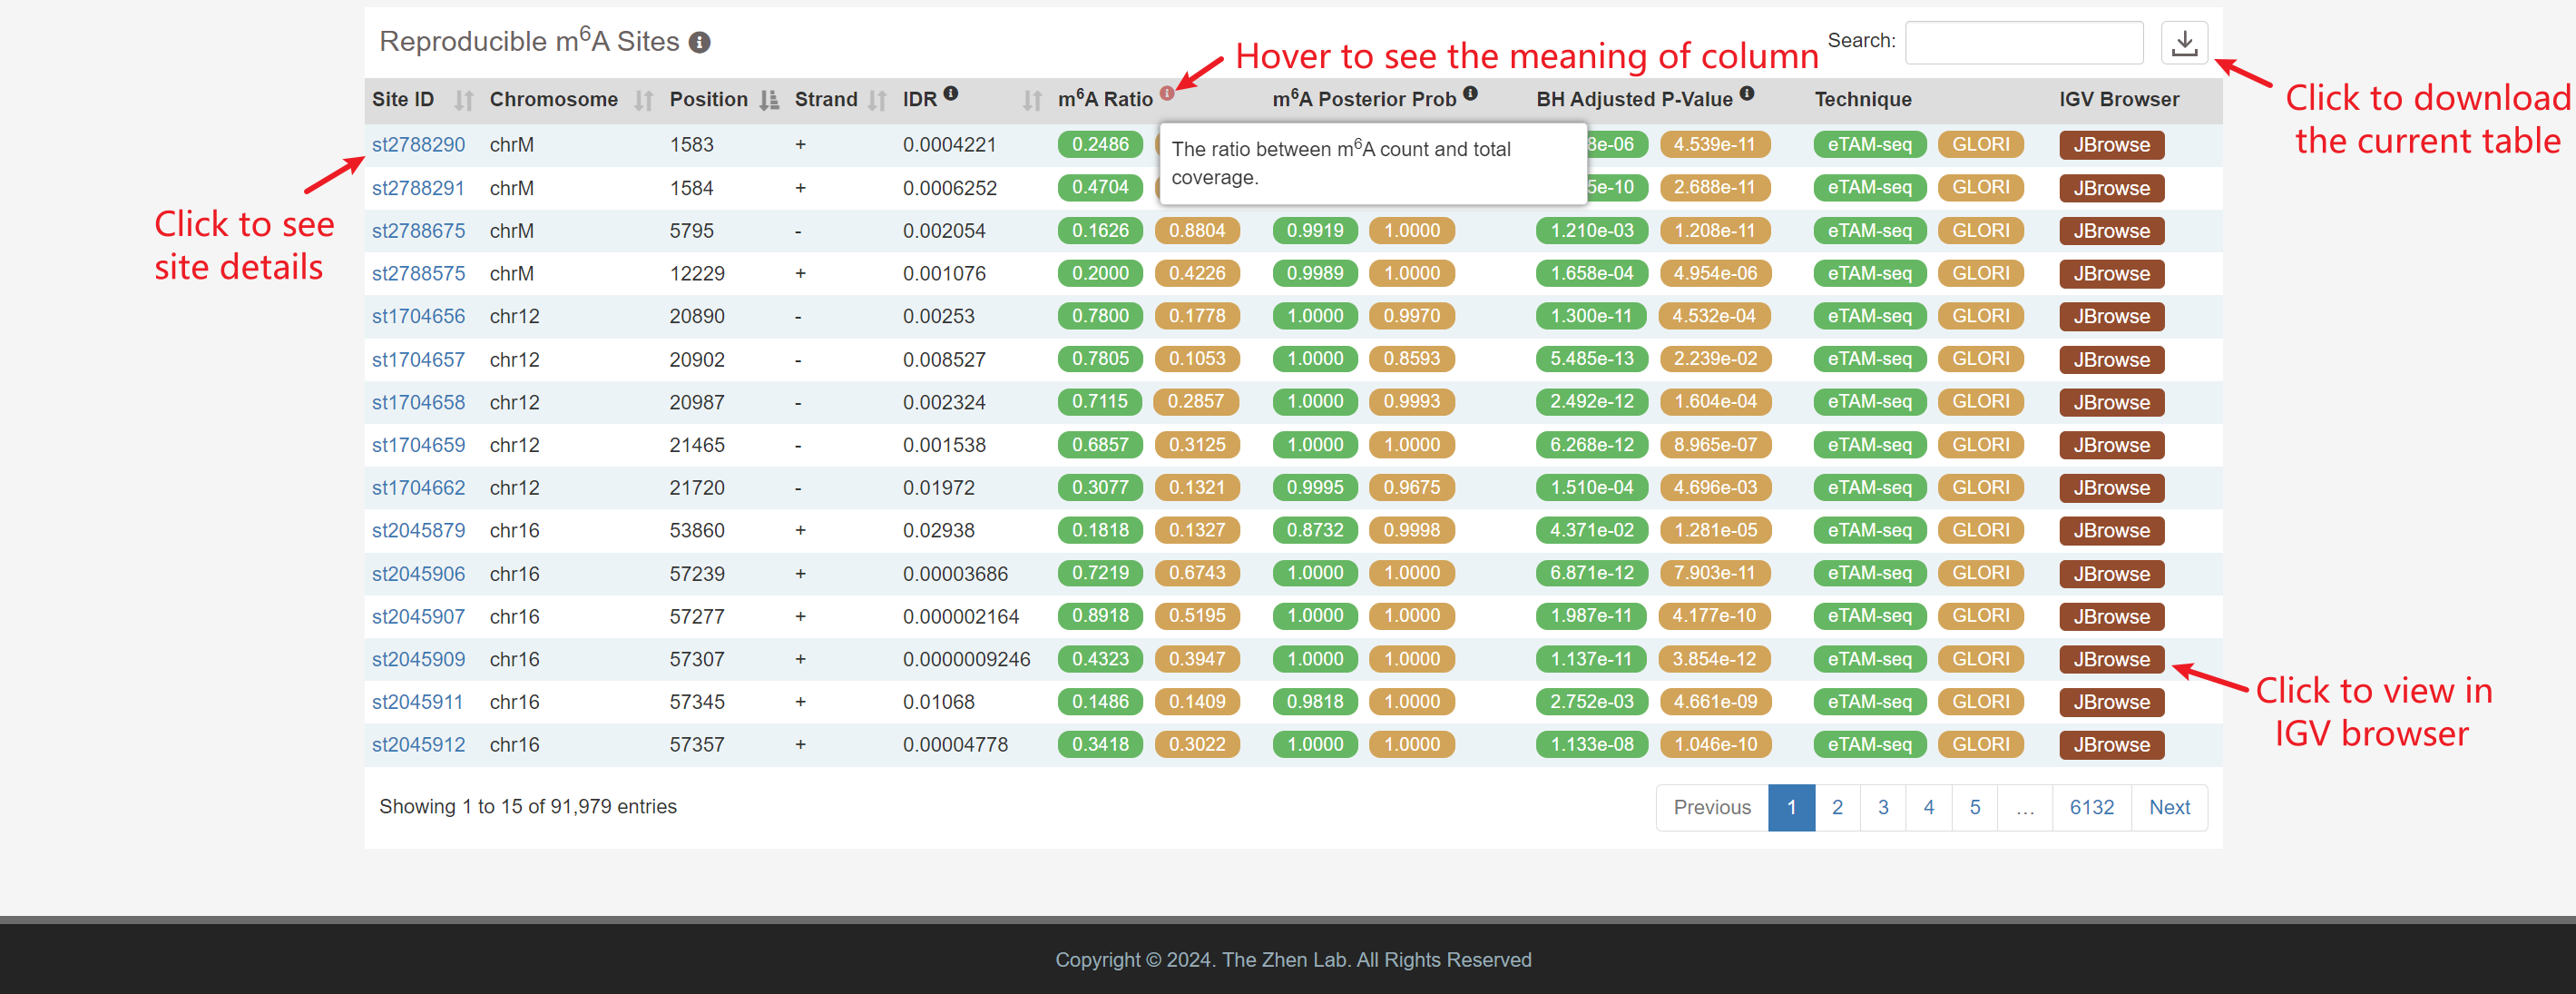
Reproducible m6A Sites: Significantly reproducible sites are identified by
model-based integration with an IDR < 0.05 .
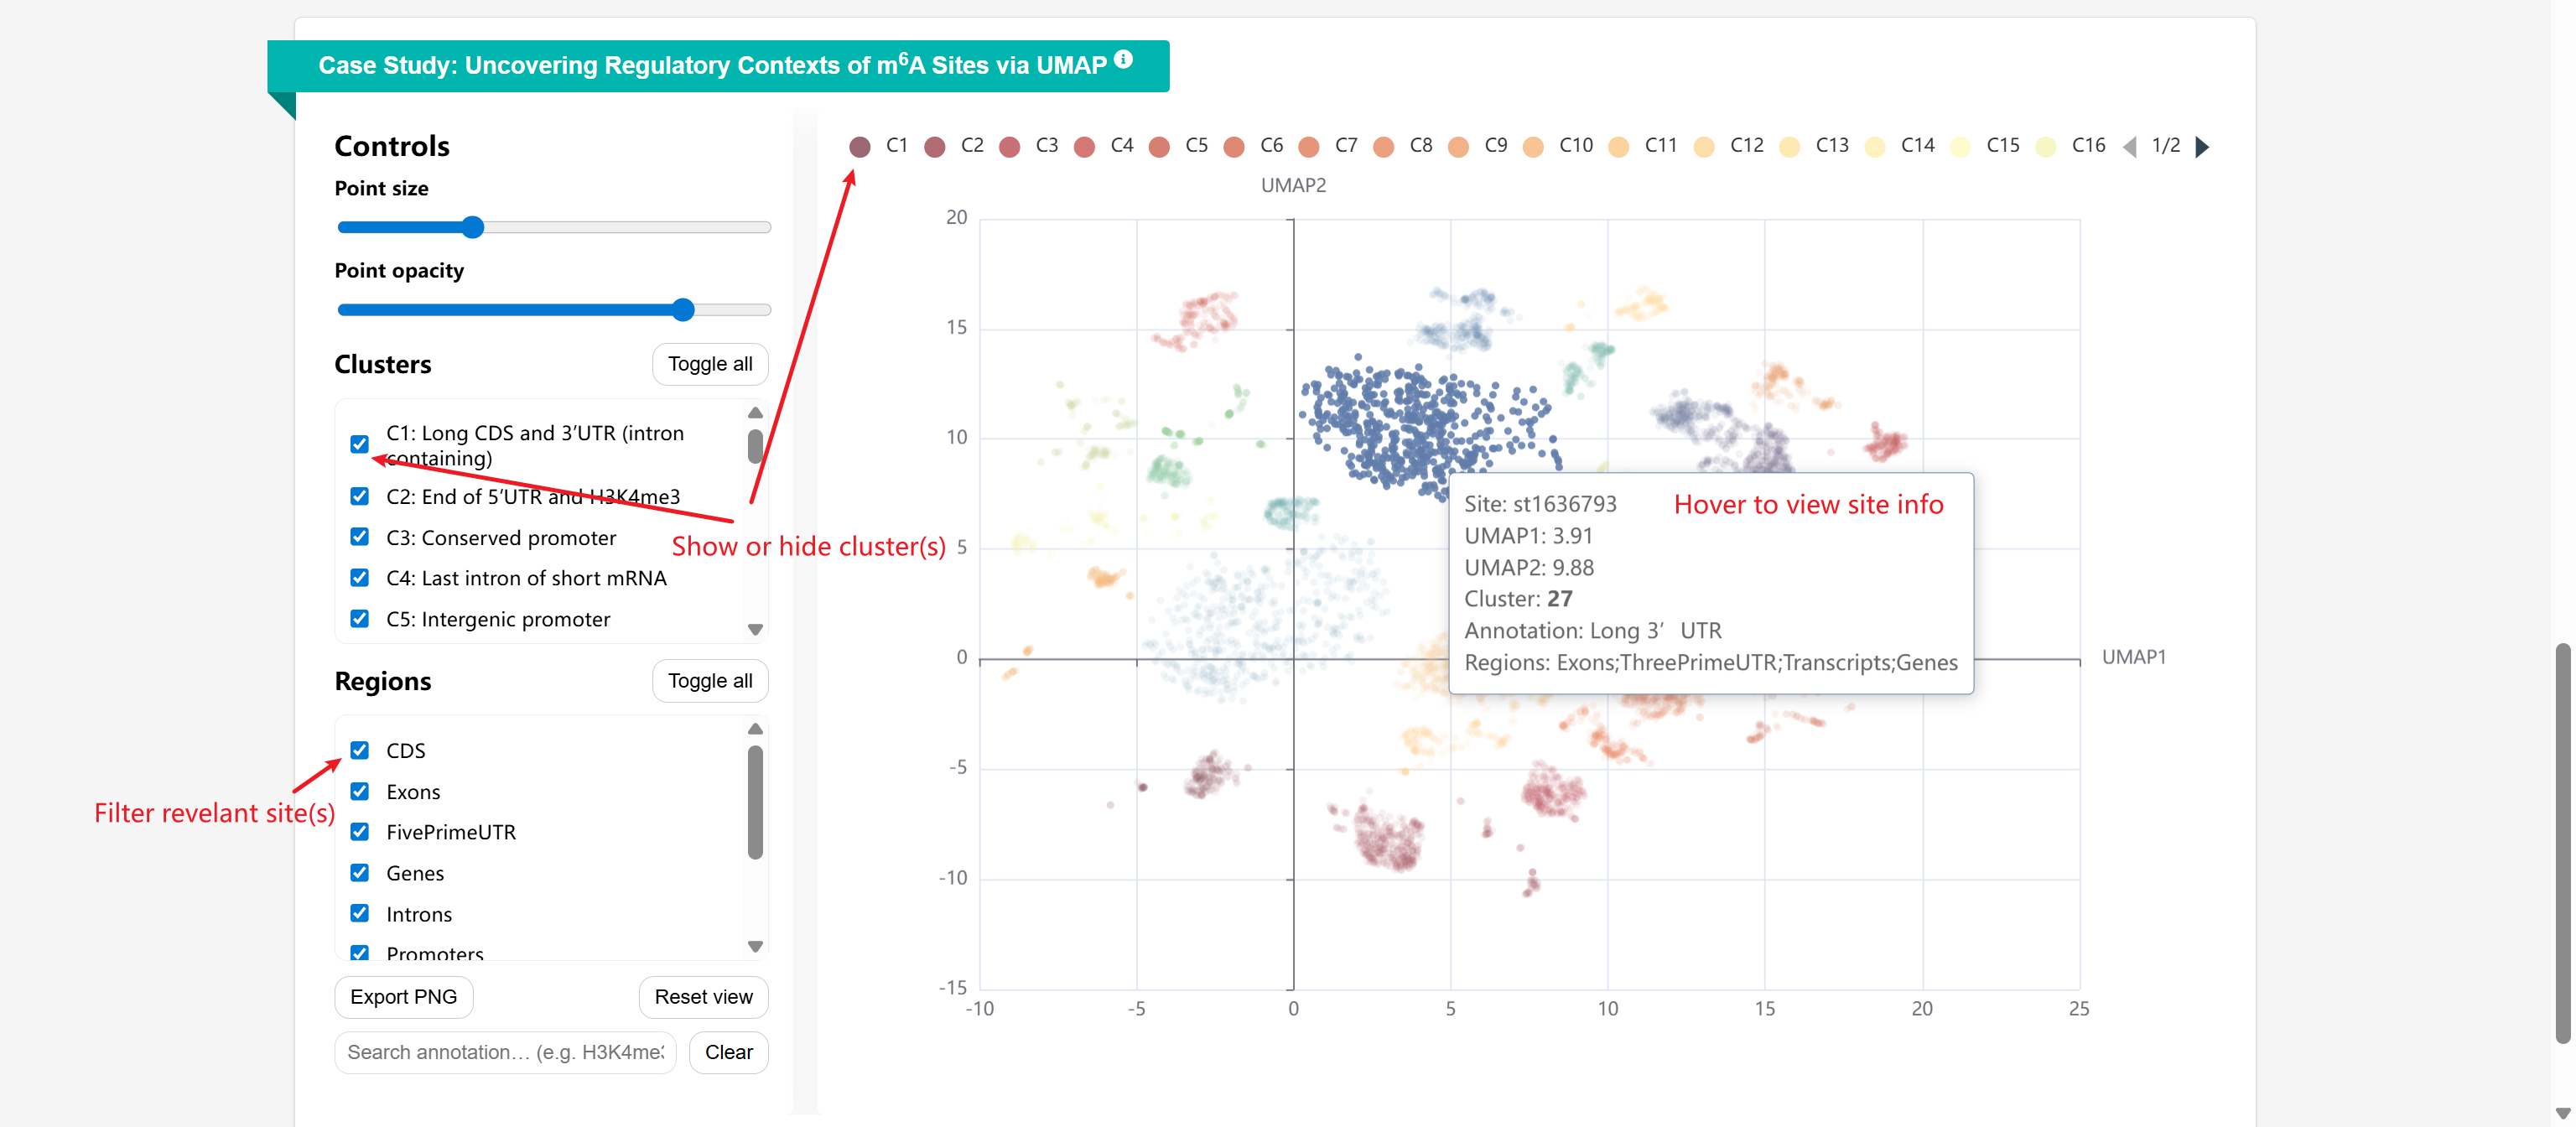
In-depth Analysis of Regulatory Contexts of Validated m6A Sites via UMAP: This analysis applies unsupervised clustering on orthogonally validated m6A sites in human.
A two-dimensional UMAP projection was generated from 184 genomic features, including m6A regulator RBP binding sites, histone modification profiles, and genomic regions (e.g., CDS, 5′UTR, 3′UTR, promoters) together with their properties (length, start, end, relative position).
Download
Multi-omics objects (MAE) and Single-omics objects (SE): Download wild type and perturbation samples, together with orthogonally validated m6A sites, differentially methylated m6A sites, m6A QTL and disease annotation, benchmark datasets, and genomic features with supplementary row data.
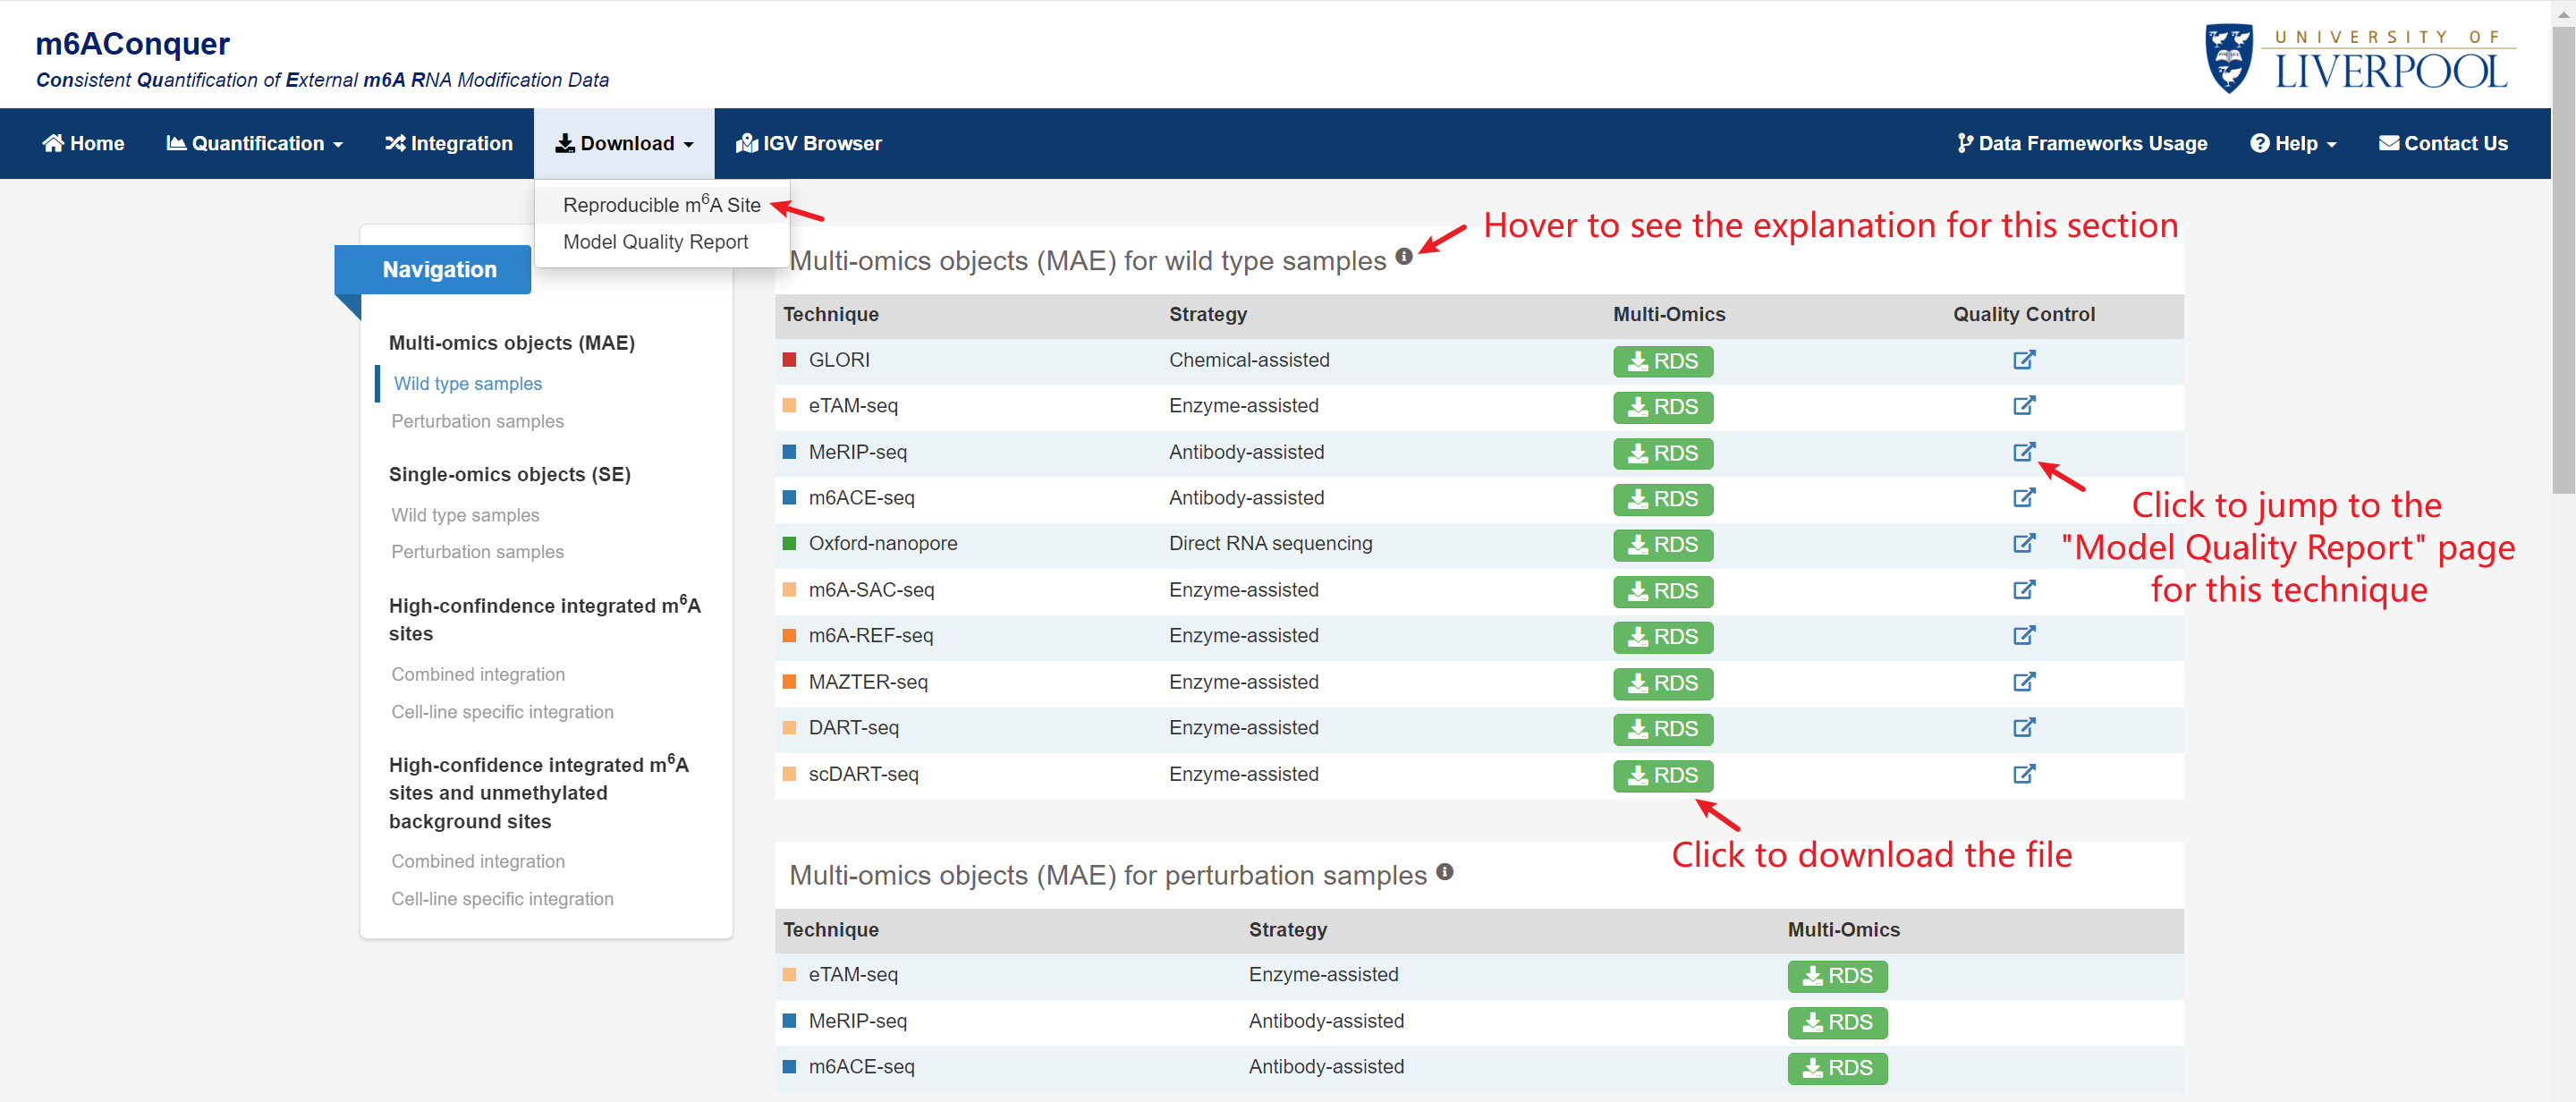
Quality Control Report: Five types of statistical models are fitted in this report, including binomial, binomial mixture, binomial-uniform mixture, beta-binomial, and beta-binomial mixture models. The report includes three types of plots: BIC bar plot, distribution histogram, and quantile-quantile plot.

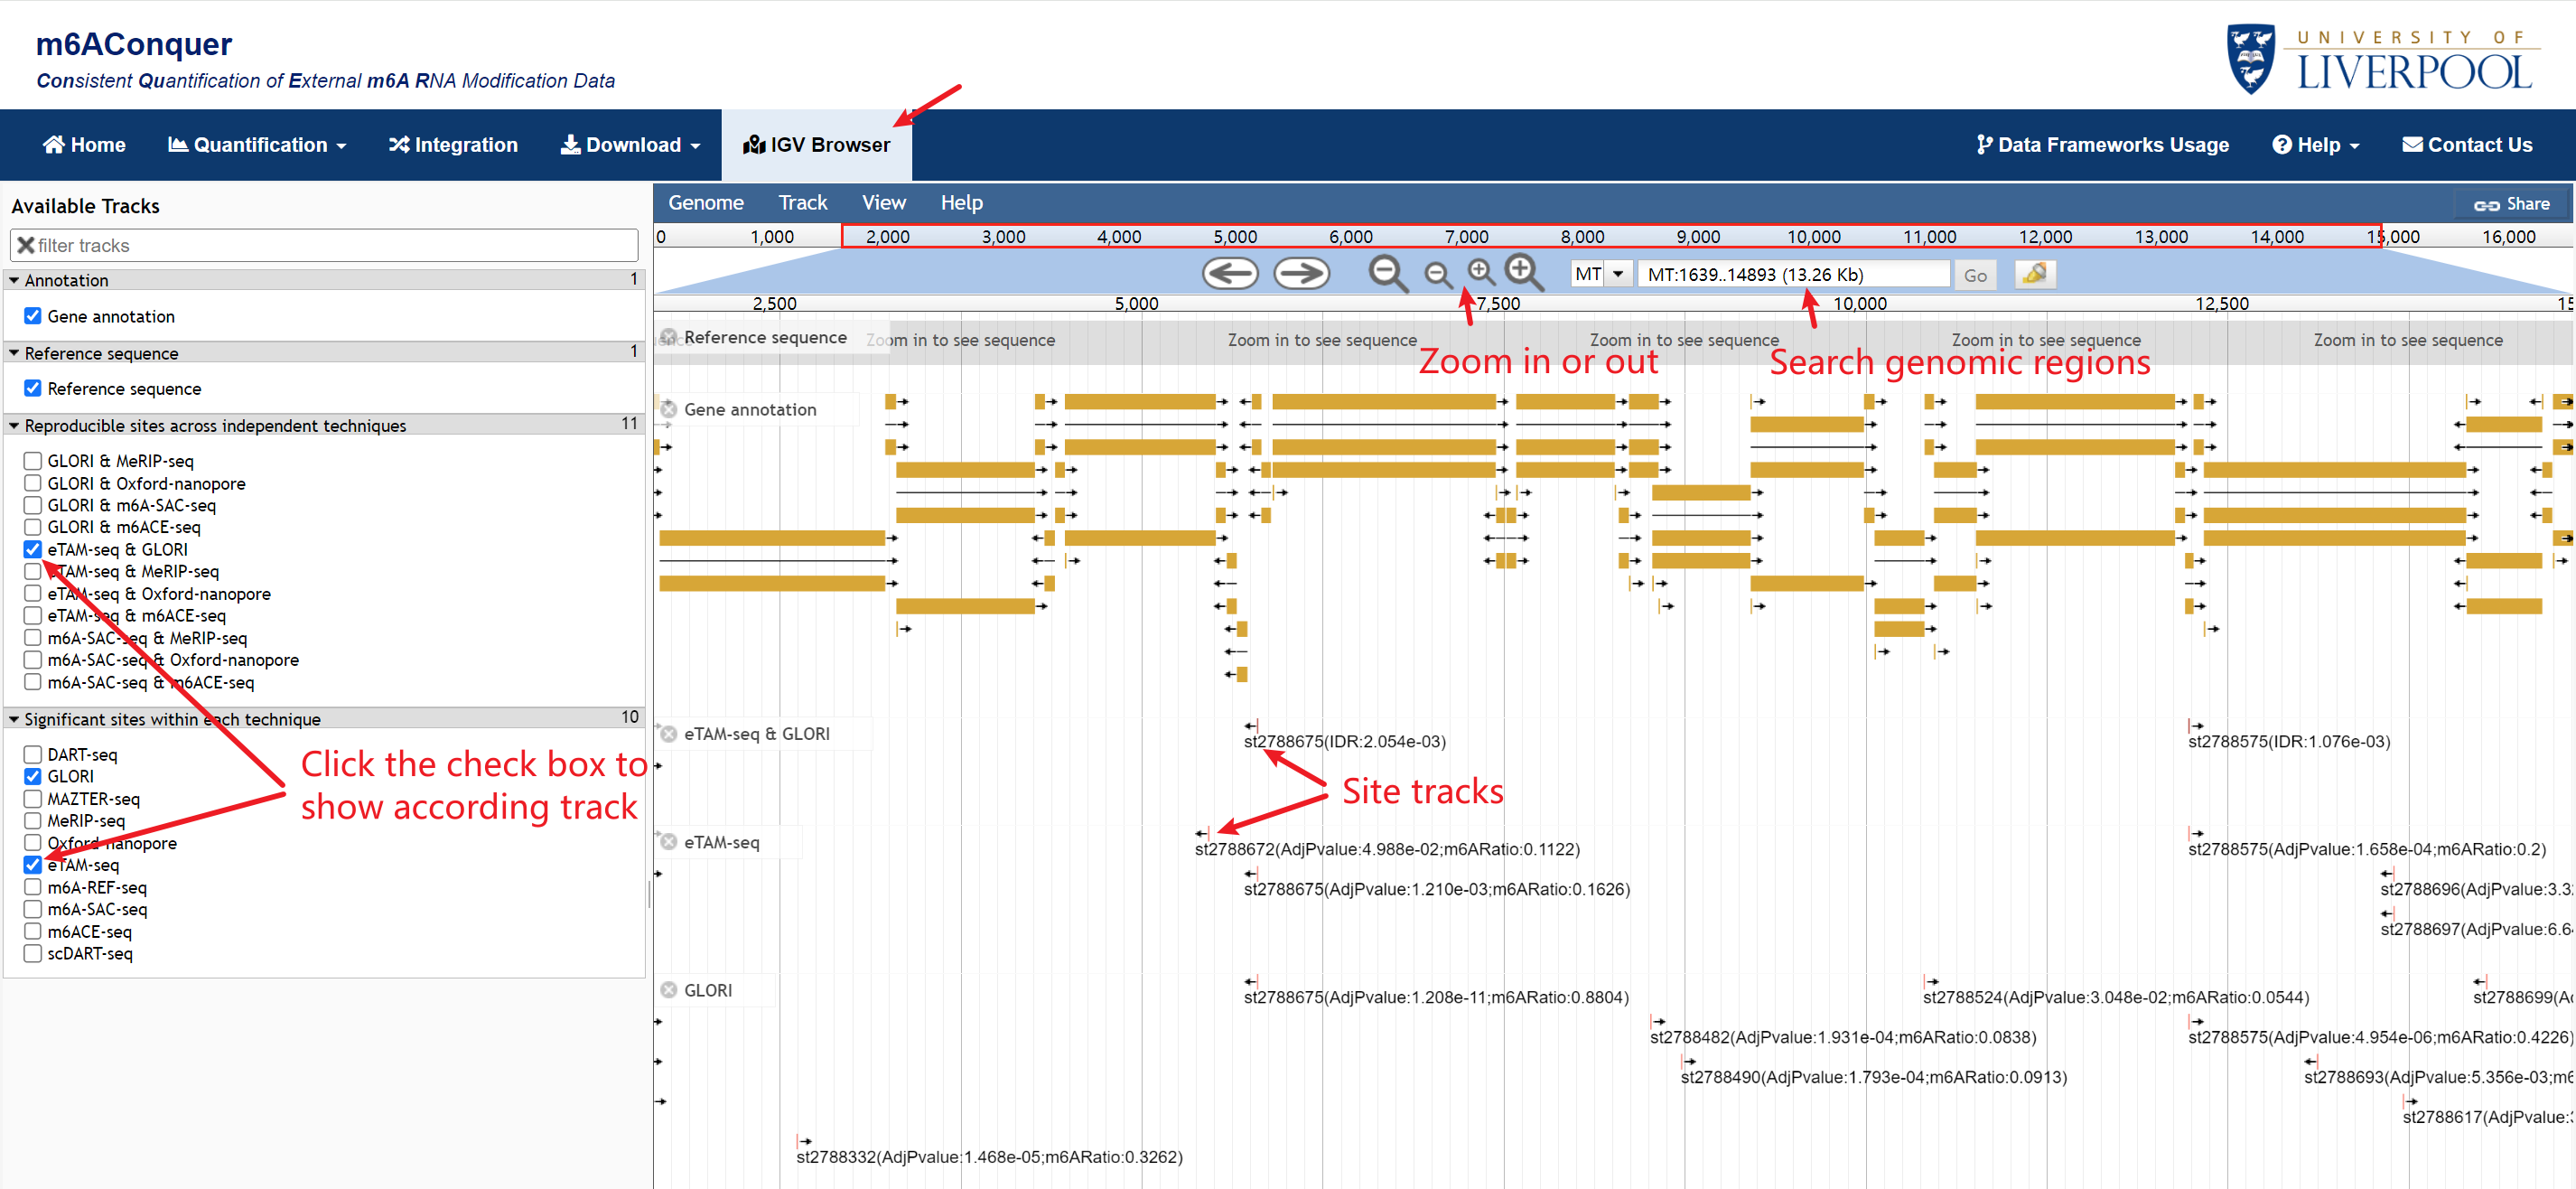
Genome Browser
Jbrowse provides visualization for the m6A sites. The tracks are organized into two groups: Orthogonally validated sites across independent techniques and Identified sites within each technique. The track of the user's modifications is displayed automatically, and other tracks can be shown by clicking the checkboxes in the left window.